One account. 453 days since inception. Every trade included.
The full account picture, every trade included, no cherry-picking. Nothing here is a projection, all figures are historical results from documented account activity.
See the trade level system logic in Trade Scenarios, or a real account's tax outcome in Tax Offset.
Net premium divided by the average equity that actually carried a covered call. This is the strategy's real yield, it measures the overlay against the capital it was deployed on.
Same net premium divided by average total account equity, including holdings that never had a call written. This dilutes the rate with capital the overlay was not applied to.
Both bases are computed from the same underlying trade ledger and shown side by side on the account dashboard. See the full calculation for each in Returns Methodology.
With 1,000 shares of a position, an account can write 10 covered calls. A human advisor typically sells all 10 at the same strike and expiration, treating them as one block. AcuBooth optimizes each contract individually, with its own strike, expiration, and timing. No two contracts are identical, and assignment risk is spread across different strikes and dates, a level of precision a human process cannot execute at scale.
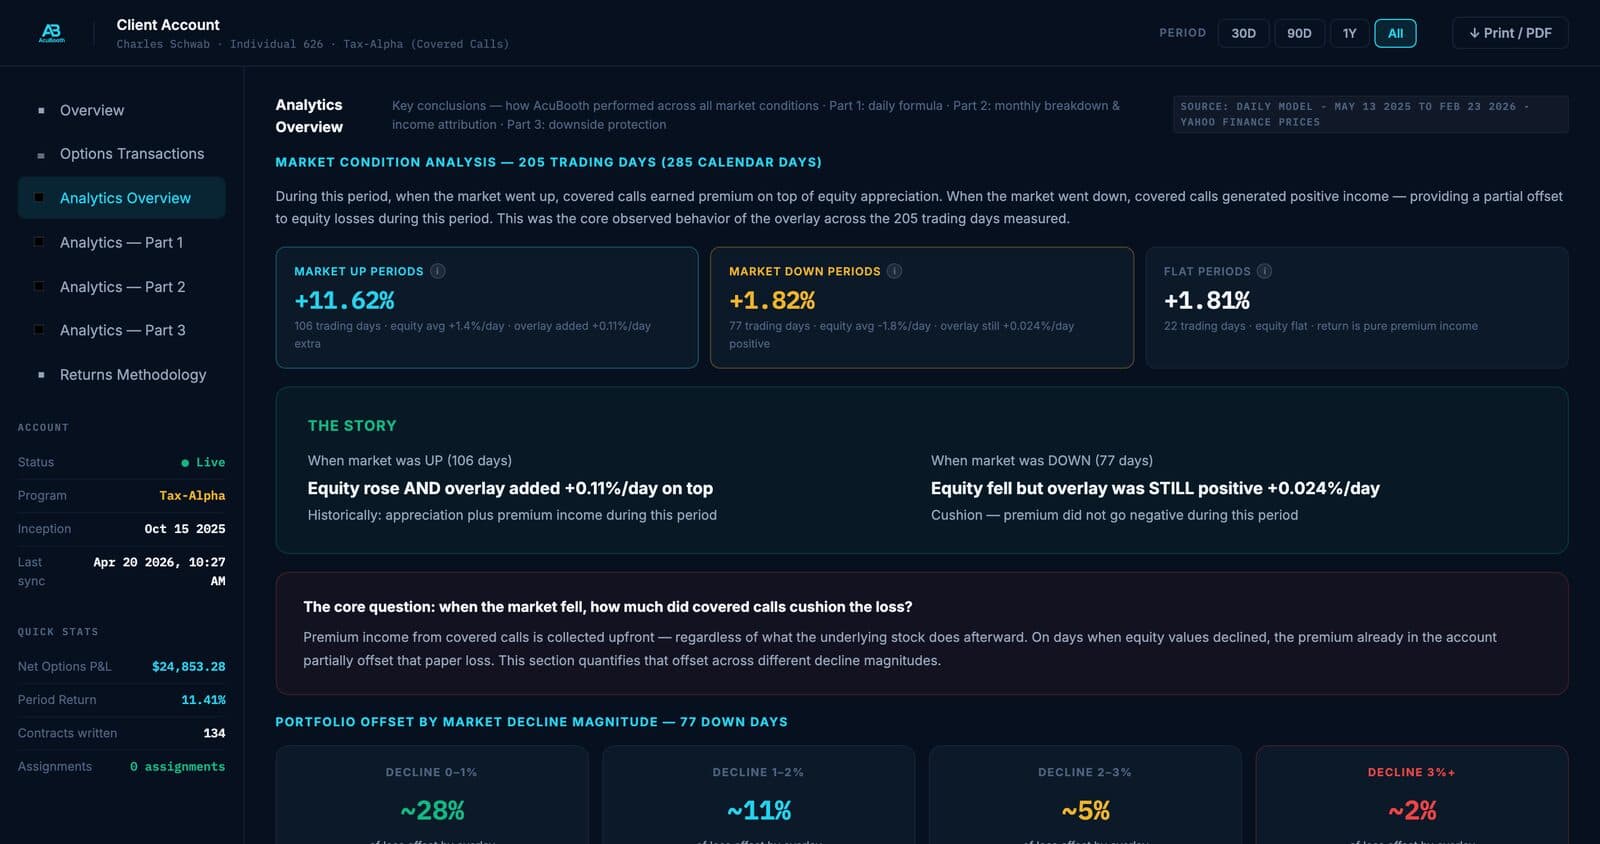
Market up, down, and flat days, broken out separately.
This is the real Analytics Overview screen the account level figures above come from. It splits results by market condition so an advisor can see whether the overlay is adding income on top of gains, cushioning declines, or both, rather than a single blended number that hides which regime is doing the work.
AVGO. Overlay on an existing client position.
Preserve Equities On. No shares assigned.AcuBooth rolled this position 80 times to keep collecting premium without triggering an assignment on shares the client wanted to keep, net premium retained after every roll is $20,592. This is real, live cash from the account's own Schwab ledger, not a modeled figure.
SPY. Overlay on a core index holding.
Preserve Equities On. No shares assigned.A core, lower-turnover holding like this one won't generate premium at the same rate as a more volatile name, but it still produced steady, real income with minimal management — 14 opening legs against 2 rolls over the full period. Not every position needs to be a headline number to be worth covering.
Want to see this on your own positions?
We will walk through the dashboard and the execution log on a real account, then map out what enrolling would look like for your firm.
Talk to our team